This report allows you to view all of your sales/production orders based on your requirement. Determine the timeframe you are looking for and then use the Filters to return a graph and a table of data. The table can be downloaded to an Excel Spreadsheet that can then be manipulated or shared via email.
Select Reports Commitment from the menu bar
The Report will default to Frequency week and the next two months
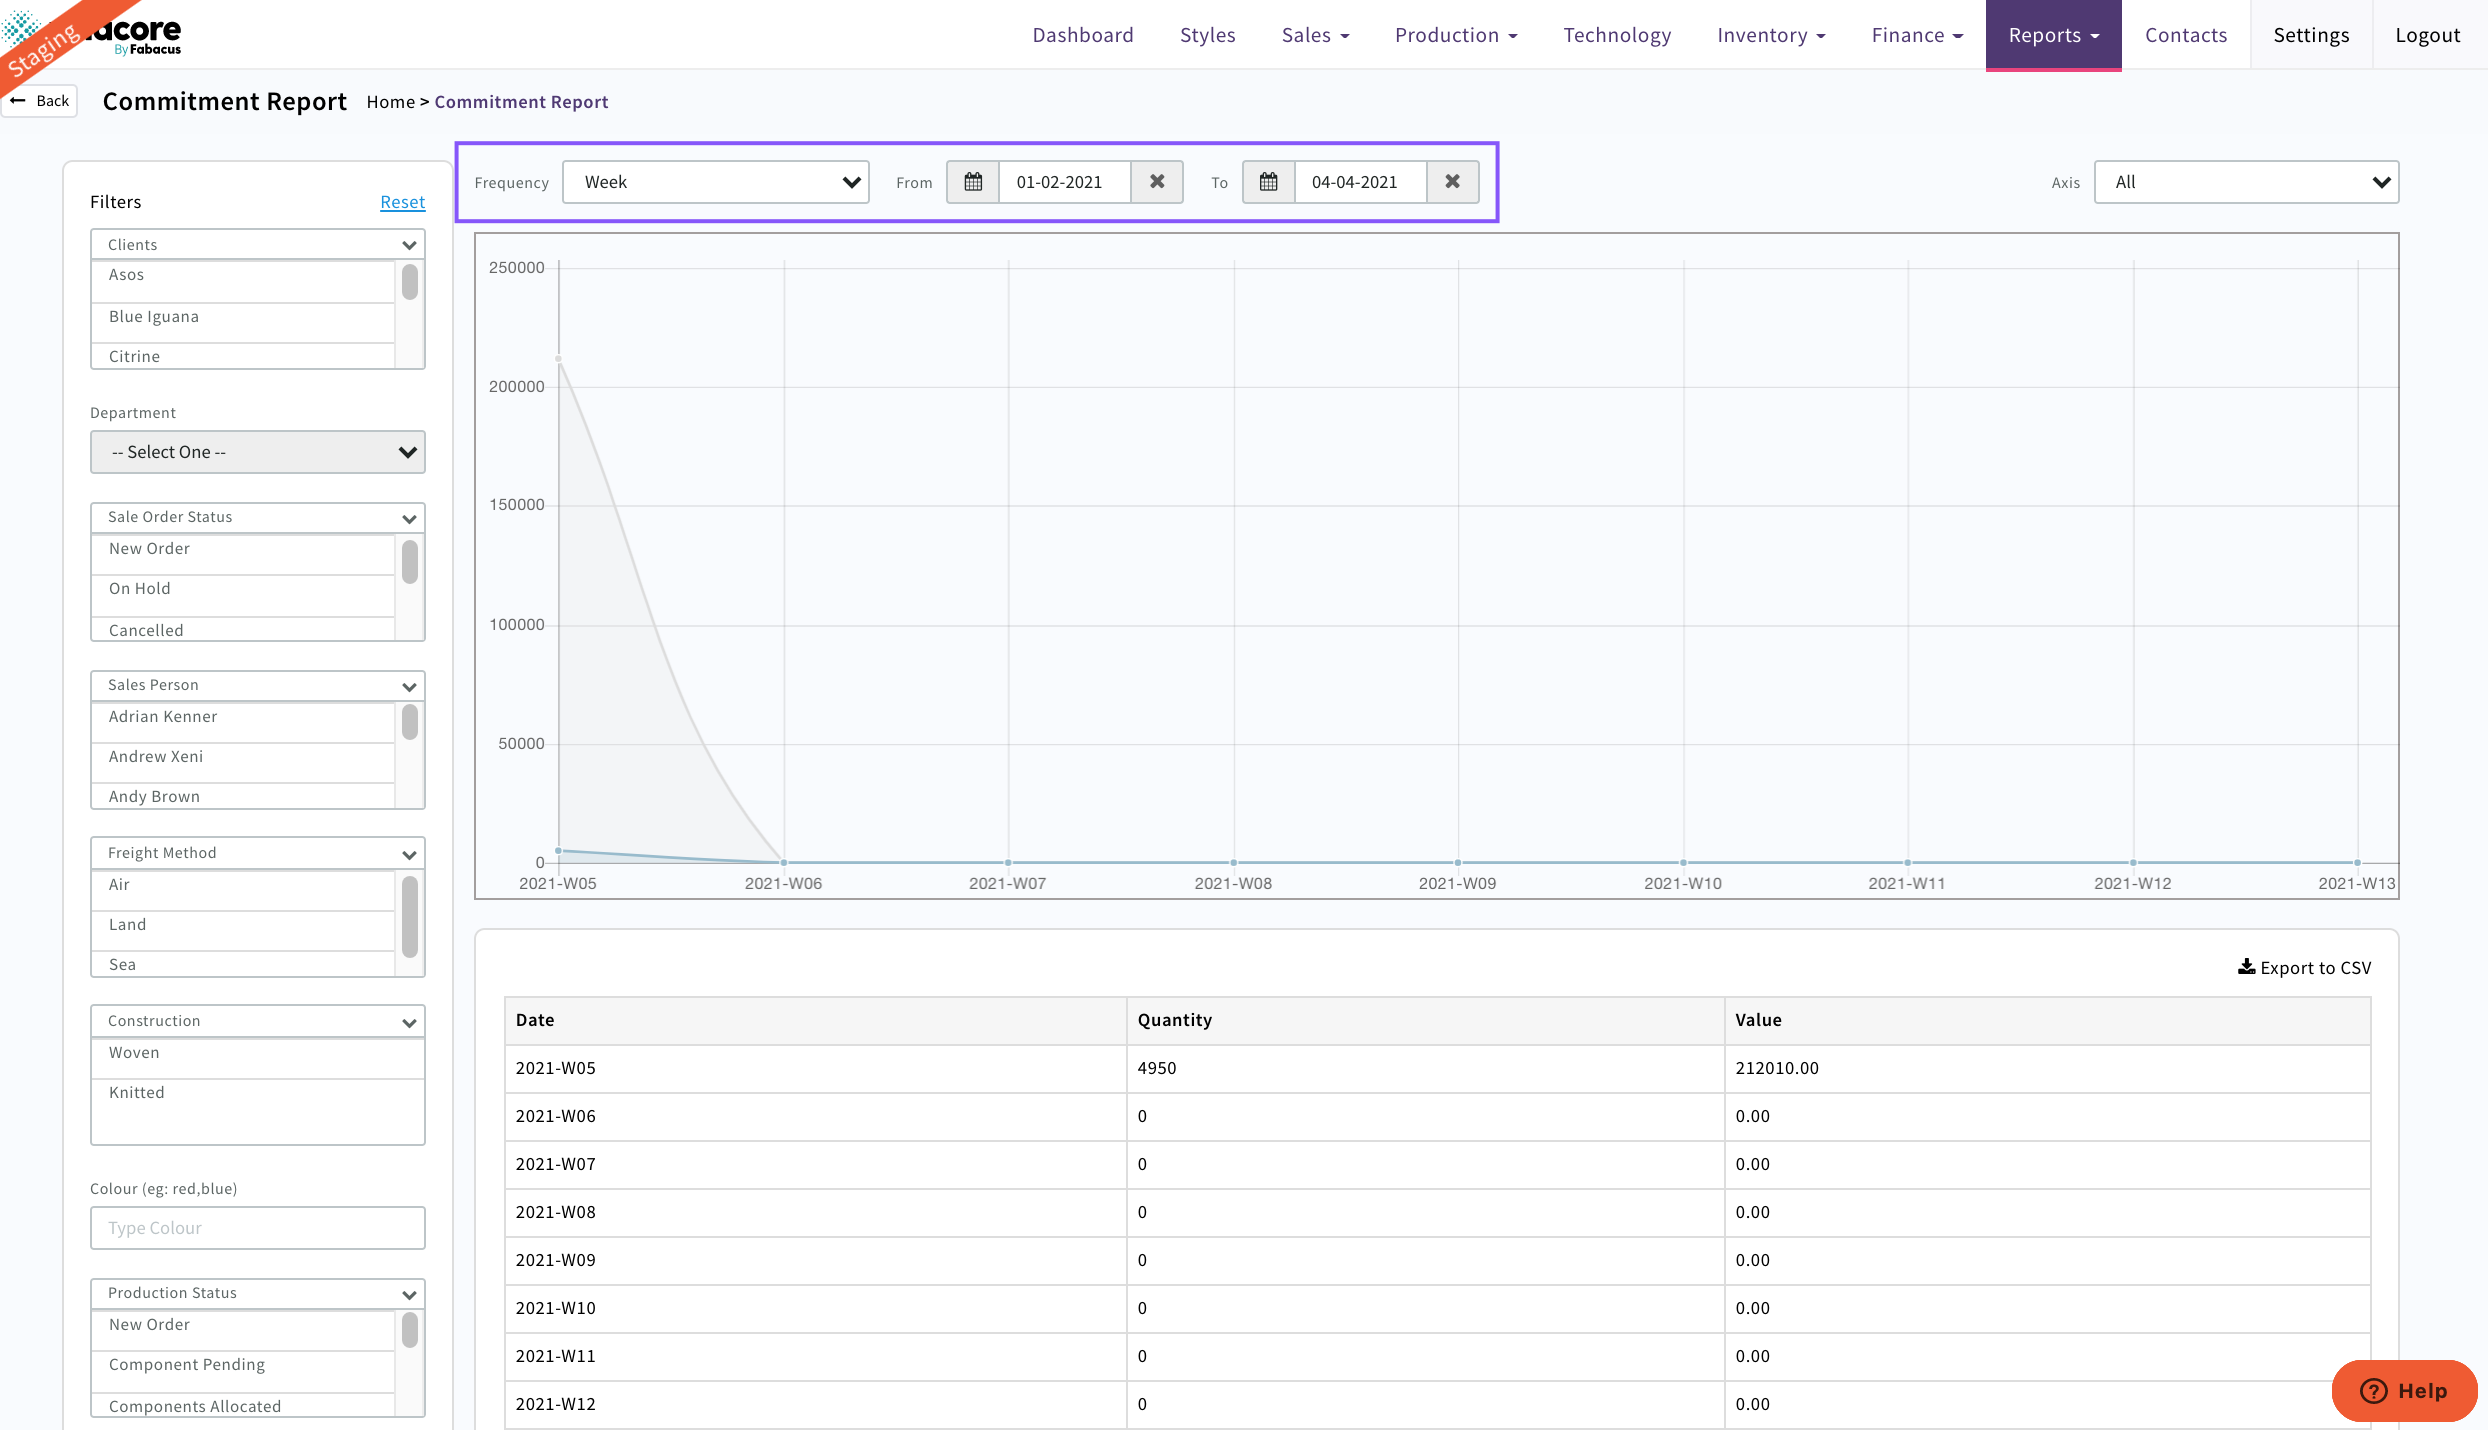
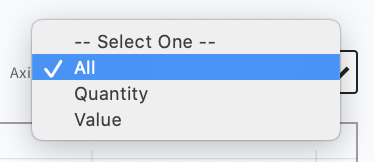
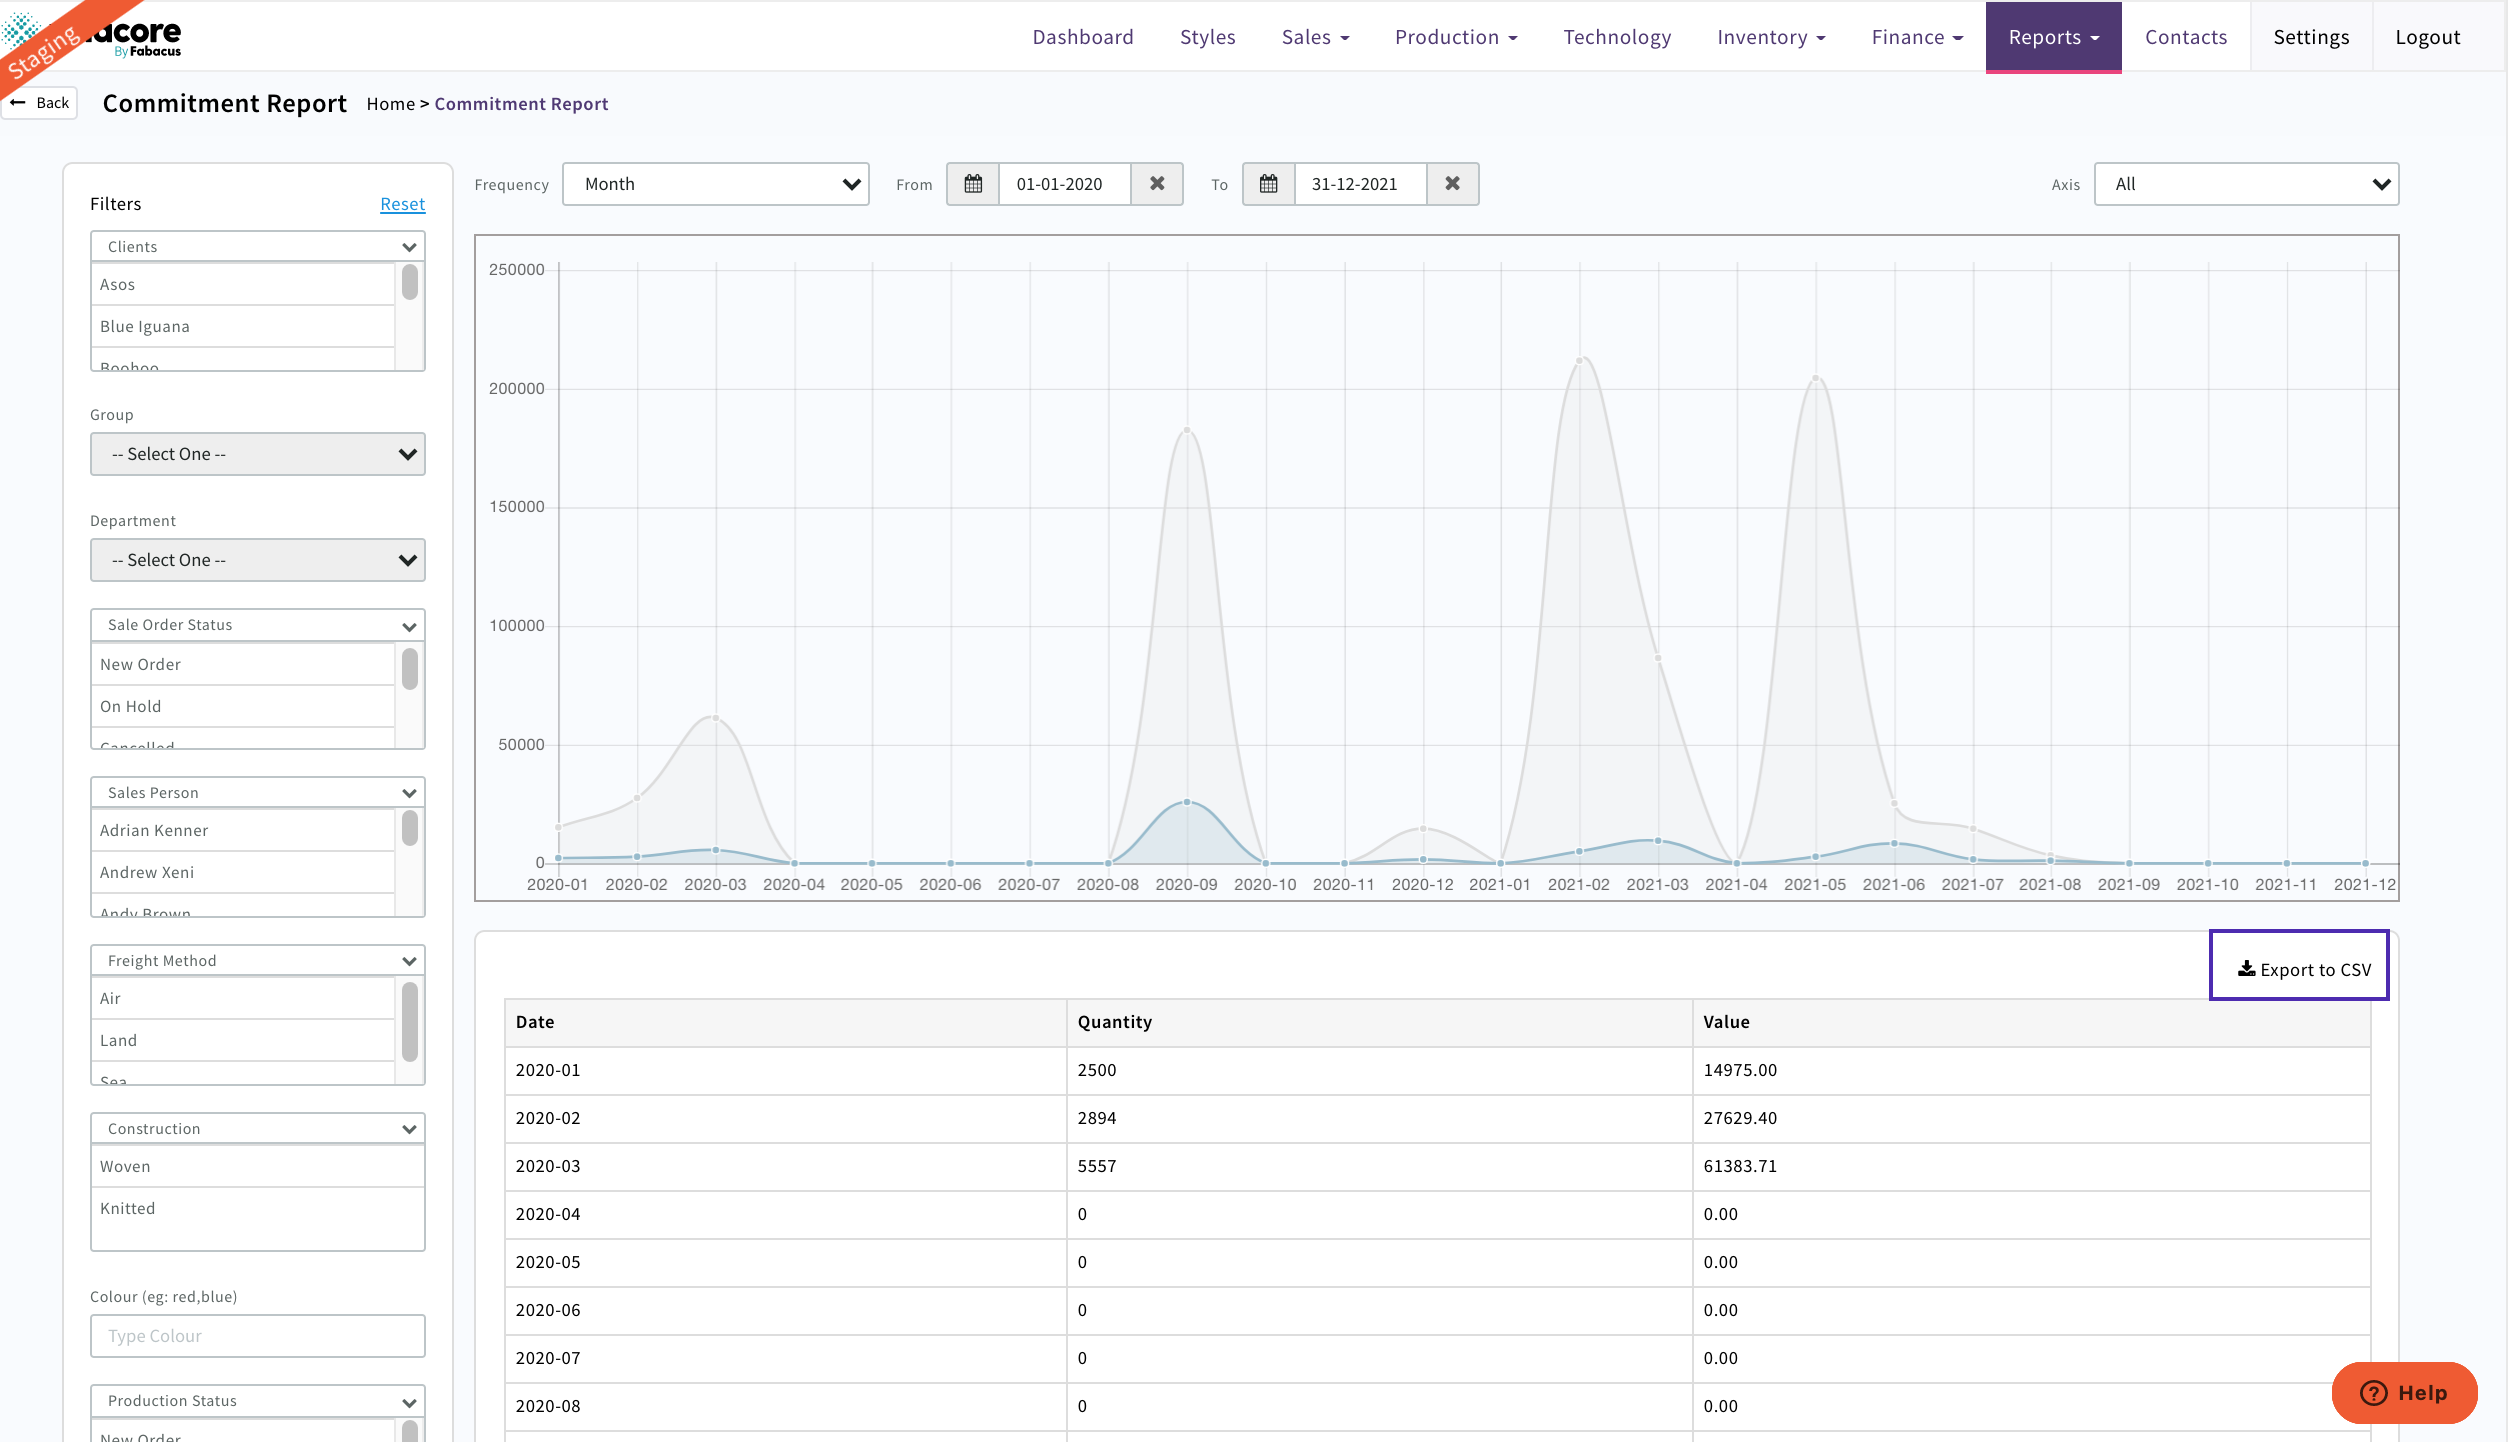
Use the Axis drop down if you only need to see units or value, if not both will display in the graph and table
![]()
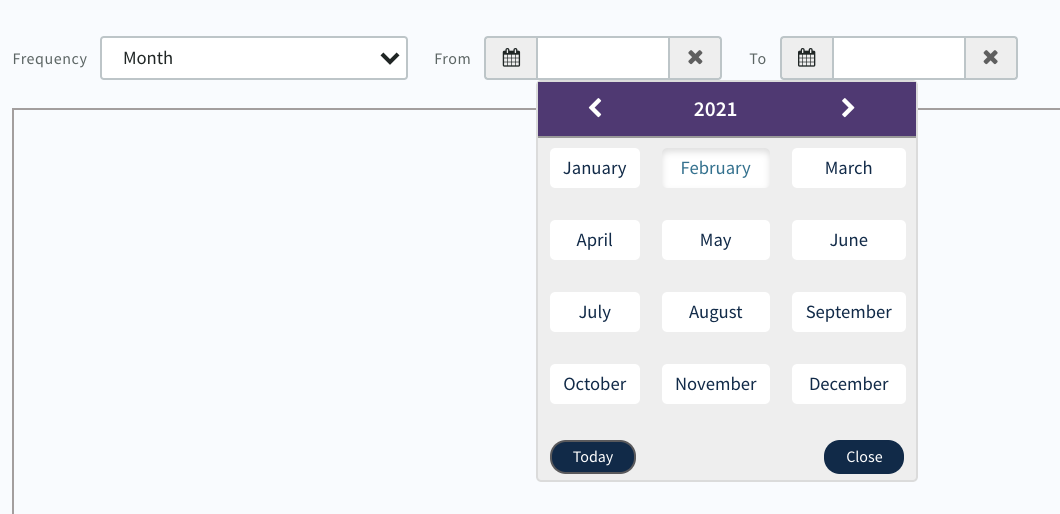
Select Frequency from drop down options
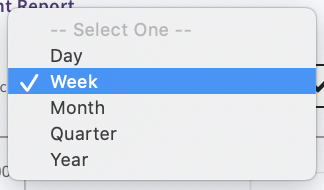
Note; A week starts on a Monday and ends on a Sunday (only these days can be selected)
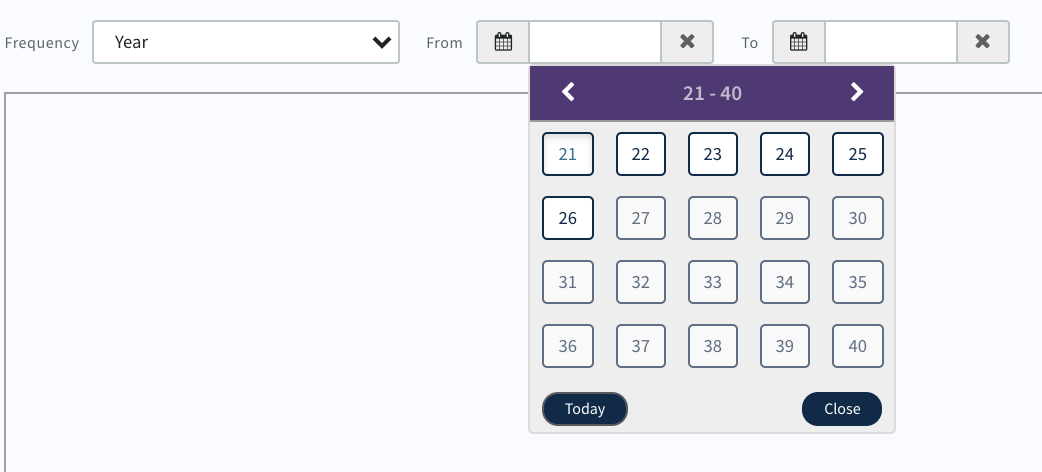
Use the 'From' and 'To' calendar to define timeframe
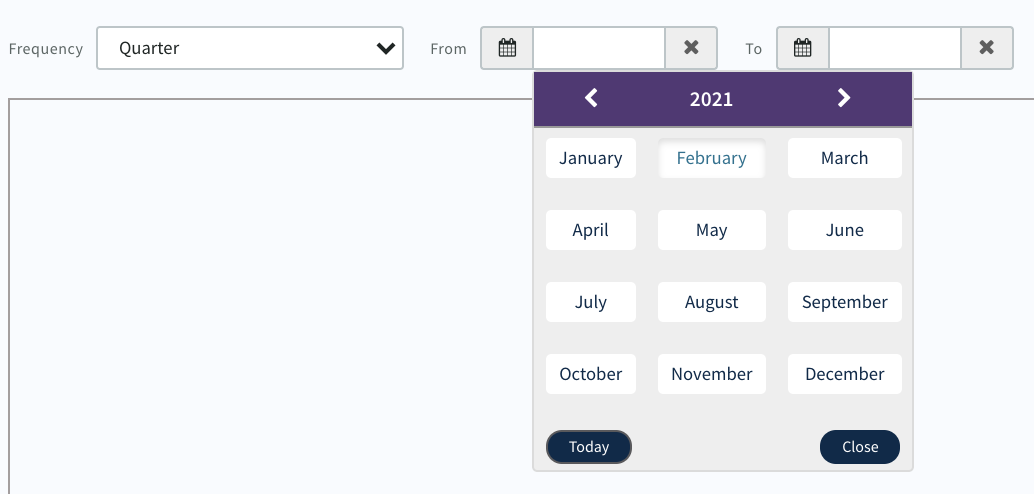
Select the start month and end month of the quarter e.g. January and March
Data will display in Graph and Data Table
Now use the Filters to drill down further by
- Client
- Group
- Department
- Sales Order Status
- Sales Person
- Freight Method
- Construction
- Colour
- Production Status
- Delivery Status
- Production Person
- Factory
Multiple values can be selected in all of the filters apart from Department and Colour
Once the data required has displayed use the Export to CSV to download your excel report
0 Comments